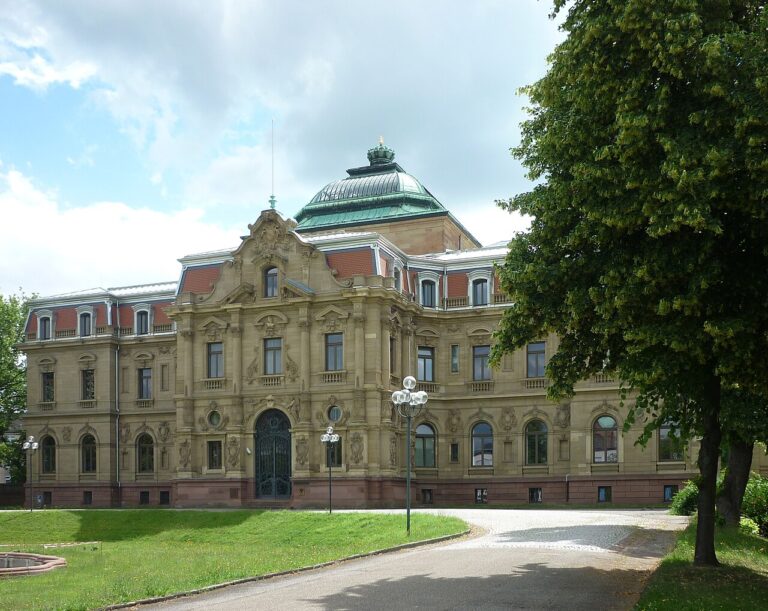




A hall with 8,000 square metres of floor area, built in 2019, in good condition. By the usual standards for logistics or commercial property the valuation would be routine. But this is a data centre – and anyone valuing data centres soon finds that the price the market pays does not depend on the 8,000 square metres, but on 30 megawatts of secured grid connection capacity.
The reference unit therefore has to change. For this asset class, floor area describes little more than the shell. What is valued is a combination of site, building, technical plant, connection capacity and contractual framework – with useful lives that diverge considerably.
The key point
A data centre is an operator-run property – the value follows the secured electrical capacity and the contractual framework, not the floor area. The building shell and the technical equipment must be considered separately – otherwise the value is systematically overstated.
Why data centres are not an ordinary commercial property
Three characteristics set these properties apart from offices, retail or logistics.
First, the capital structure: at a colocation data centre the larger part of the investment regularly falls not on the shell and core but on the technical building services: medium-voltage switchgear, transformers, uninterruptible power supply, standby generators, cooling plant, fire protection and security systems. The property in the narrow sense is the smaller share.
Second, the limited alternative use potential: a hall with a 1.5-metre raised floor, chilled-water distribution and redundant power feeds cannot be put to another use without substantial strip-out. If the operator fails, the circle of alternative users is small and essentially confined to the same industry.
Third, the contractual logic: what is let is not floor area but capacity. The customary market reference is the price per kilowatt of IT capacity provided per month; area, cooling and connection are included in it. An income approach built on a rent per square metre misses the market.
Not every data centre is the same: the asset types
The market distinguishes several operator models, and the classification is no mere formality for the valuation. The type determines the income structure, the tenant risk and the third-party usability – and with it the choice of valuation method.
-
Hyperscale data centres
- Large facilities of roughly 20 megawatts and above for a single cloud provider
- Frequently build-to-suit with lease terms of ten to fifteen years
- Strong credit quality but maximum concentration risk; the cash flow resembles a corporate bond
-
Wholesale colocation
- Contiguous capacity blocks of roughly one megawatt and above for a small number of major tenants
- Long lease terms, stable income
- Little diversification: the departure of a single tenant hits the property noticeably
-
Retail colocation
- Many tenants with individual racks or cages, shorter lease terms
- Granular price structure per kilowatt
- Broad diversification reduces the risk of default; operating effort and the operator's share of the income are at their largest
-
Carrier hotels and interconnection sites
- Properties at internet exchange points with a large number of network operators on site
- The value arises from connectivity, not from floor space
- Network effects barely reproducible elsewhere; above-average prices per kilowatt in the long term
-
Enterprise data centres
- Owner-occupied facilities of companies and the public sector
- No observable market rent; a notional capacity-based rent has to be applied
- The question of third-party usability decides the risk allowance
-
Edge data centres
- Small, decentralised sites close to the user, mostly below one megawatt
- Often modular or containerised construction
- The emphasis shifts towards operating equipment; correspondingly short useful lives
| Type | Typical IT capacity | tenant structure | Lease term | Relevant to the valuation |
|---|---|---|---|---|
| Hyperscale data centres | from approx. 20 MW, campuses sometimes in the three-digit range | a single cloud provider | 10–15 years | concentration risk; bond-like cash flow |
| Wholesale colocation | 1–20 MW per unit | a small number of major tenants | 5–15 years | stable but poorly diversified income |
| Retail colocation | a few kW up to 1 MW per tenant | many tenants | 1–5 years | granular income; high operating effort |
| Carrier hotels and interconnection sites | mostly below 10 MW | many network operators | mixed | connectivity as the value driver; premium prices per kilowatt |
| Enterprise data centres | according to own requirements, often 0.3–5 MW | owner occupation | – | notional rent required; third-party use decisive |
| Edge data centres | below 1 MW | depending on the operator model | short to medium | high share of operating equipment; short useful lives |
Hybrid forms occur in practice. What matters for the valuation is the actual operator and contract model, not the label in the marketing brochure.
The major European data centre markets
The European market is concentrated in a small number of metropolitan regions: the established FLAP-D marketsFLAP-D stands for the five established European data centre markets of Frankfurt, London, Amsterdam, Paris and Dublin. as well as growing secondary markets from Madrid to Warsaw. The map shows the orders of magnitude of installed IT capacity.
-
1 London FLAP-D UKapprox. 1,200 MW established
Europe's largest and most liquid data centre market with a broad colocation and hyperscale base.
-
2 Dublin FLAP-D IEapprox. 1,200 MW grid connection restricted
Favoured hyperscale market; new grid connections are effectively frozen by the network operator's moratorium.
-
3 Frankfurt FLAP-D DEapprox. 1,000 MW established
Germany's largest market around the DE-CIX internet exchange; scarcity of land and power shapes supply.
-
4 Amsterdam FLAP-D NLapprox. 600 MW grid connection restricted
Established FLAP-D market with restrictive municipal siting policies.
-
5 Paris FLAP-D FRapprox. 600 MW established
The central French market with growing hyperscale demand.
-
6 Milan ITapprox. 250 MW growing
An emerging southern European market with strong development activity.
-
7 Madrid ESapprox. 250 MW growing
A growth market with comparatively good availability of power and land.
-
8 Zurich CHapprox. 250 MW established
A market driven by the financial centre with stable colocation demand.
-
9 Berlin DEapprox. 200 MW growing
A growing secondary market with increasing hyperscale activity.
-
10 Marseille FRapprox. 200 MW established
Hub of the subsea cables to Africa and Asia; connectivity is the key value driver here.
-
11 Stockholm SEapprox. 200 MW established
Cheap renewable power and established heat reuse in the district heating network.
-
12 Munich DEapprox. 150 MW growing
A secondary market with demand from industry and cloud regions.
-
13 Warsaw PLapprox. 150 MW growing
The largest eastern European market with dynamic growth.
-
14 Oslo NOapprox. 150 MW established
A hydropower-based market with low electricity prices.
Major European data centre markets with approximate installed IT capacity (orders of magnitude, as at 2026). Clicking a list entry highlights the market on the map – and vice versa.
The real value driver: secured grid connection capacity
In the established European locations, electrical capacity is the bottleneck, not development land. A binding grid connection commitment from the distribution or transmission system operator for a defined capacity, with a reliable date and the connection charge paid, is therefore the central value-forming circumstance.
For the valuation this means a clean separation:
- A site without secured capacity is an ordinary commercial site and is to be derived from the standard land value.
- A site with a reliable connection commitment is traded by the market at a substantial premium that does not follow from the standard land value and must therefore be derived separately.
- The commitment is regularly tied to the site and limited in time – lapse, evidence requirements and running deadlines belong in the valuation report.
In practice this means: inspect the connection commitment in the original, not the statement in the marketing brochure. Capacity "indicated as available" and capacity secured by contract represent two entirely different values.
Incidentally, the same dependence on secured grid connection capacity also shapes solar farms – see the article market value appraisal of ground-mounted photovoltaics.
Which valuation method fits
The ImmoWertV does not provide a special method for operator-run properties. Under Section 6 ImmoWertV, the decisive method is the one that reflects market behaviour – and that depends on the state of the property.
| for the | scenario | Notes |
|---|---|---|
| Let colocation or wholesale property with contracts in place | Income approach in accordance with §§ 27 et seq. ImmoWertV | Gross income from capacity-based rent; where cash flows are uneven, the periodic method under Section 30 ImmoWertV |
| Operator-run property, value-add, ramp-up phase, international addressees | DCF method | Models the letting ramp-up, expansion phases and investment cycles explicitly; standard for Red Book and IFRS valuations |
| Site with a connection commitment, not yet developed | Residual value calculation | Construction costs of the technical plant dominate; construction period, grid connection costs and pre-letting are the critical assumptions |
| Plausibility review, insurance, allocation for tax purposes | Cost approach | Not market-based as a stand-alone method; indispensable, however, for separating the building from operating equipment |
One point deserves particular attention here: the distinction between the building and operating equipment – cooling plant, UPS, standby generators and rack systems serve the operation, not the use of the building. For purchase price allocation, depreciation and property tax this separation is mandatory – and it changes the assessment bases considerably.
Value-determining property characteristics in detail
Beyond the connection capacity, technical and legal characteristics shape the value:
- Availability and redundancy level – the design of the power feed, UPS and cooling, documented through availability classes under EN 50600 or a Tier classification. The level determines the achievable price per kilowatt.
- Power density per rack – classic designs of five to ten kilowatts per rack reach their limits with AI and HPC workloads. What is decisive for future viability is whether liquid cooling can be retrofitted without interrupting operations.
- Cooling concept and water demand – free cooling, adiabatic systems and compression cooling differ markedly in operating costs, water consumption and ease of obtaining permits.
- Connectivity – the number of carriers, redundancy of the routes, distance to an internet exchange. Carrier-neutral properties close to an exchange achieve higher income on a lasting basis.
- Permissibility under public law – classification under planning law, emission control permits for standby generators, water law requirements for storing diesel fuel, noise protection towards neighbours.
- Land reserve – expansion areas are only valuable if additional capacity can actually be obtained.
The income side: rent per kilowatt instead of per square metre
As a rule, gross income consists of a capacity-based base component and the pass-through of the energy supply. Four questions are decisive for the valuation.
First, whether the electricity costs are passed through in full. A contract without an effective pass-through shifts the price risk to the owner and justifies a higher risk assumption.
Second, the remaining term and indexation of the contracts. Given the level of investment and the low alternative use potential, a short weighted average unexpired term weighs more heavily here than for standard properties.
Third, the tenant structure: a single hyperscaler as user brings credit quality, but also a considerable concentration risk: if it moves out, the property faces no broad market.
Fourth, the backlog of maintenance and replacement in the technical equipment. Unlike office properties, it is not visible to the eye and can only be derived from maintenance records, battery age and the history of the cooling plant.
Remaining useful life: shell and technical equipment diverge
A blanket assumption for the property as a whole regularly produces wrong results for data centres. The building shell reaches the usual order of magnitude of a commercial hall. The value-determining technical equipment falls considerably short of that, and the fit-out of the IT space follows even shorter cycles, because power densities and cooling concepts develop rapidly.
It is therefore appropriate to consider the components separately, each with its own remaining useful life and its own replacement cycles within the cash flow. Anyone who stretches the technical equipment over the life of the building conceals a reinvestment requirement that regularly runs into tens of millions for these properties.
Regulation as a value factor: the German Energy Efficiency Act
Since 2023, data centres in Germany have been subject to their own obligations under energy law. Under Section 3 no. 24 EnEfG (Energy Efficiency Act), a data centre is a structure with a non-redundant rated electrical connected load of 300 kilowatts or more. Section 11 EnEfG requires these facilities to achieve:
- power usage effectiveness (PUE) of no more than 1.5 from 1 July 2027 and no more than 1.3 from 1 July 2030 for data centres commissioned before 1 July 2026,
- no more than 1.2 for data centres commissioned from 1 July 2026, plus an energy reuse factor of 10 percent, rising to 15 percent from July 2027 and 20 percent from July 2028,
- electricity sourced 50 percent from renewable energy since 1 January 2024 and 100 percent from 1 January 2027,
- an energy or environmental management system under Section 12 EnEfG, together with the reporting obligations under Section 13 EnEfG to the energy efficiency register for data centres under Section 14 EnEfG.
For the valuation these are not footnotes. An existing property that cannot structurally reach the PUE target carries a concrete retrofit requirement – and that is to be reflected as a special property-specific characteristic under Section 8 (3) ImmoWertV through a market-standard deduction, not hidden in the property yield rate. Conversely, a secured offtake of waste heat by a heat network is a valuable advantage.
Note on the current legal position
On 24 June 2026 the Federal Cabinet adopted an amendment to the EnEfG intended to raise the threshold to 500 kilowatts of IT capacity, soften the waste heat requirements and extend deadlines. The procedure in the Bundestag and Bundesrat had not been concluded at the time of writing; until it enters into force the existing law applies. Which version an appraisal report must apply is determined by the valuation date.
Typical valuation occasions
- Transaction and Due Diligence – determining the purchase price, reviewing the connection commitments, reconciling the technical documentation with the contracts.
- Financing – in the mortgage lending value report under the BelWertV, the limited alternative use potential has a direct effect; sustainably achievable income and assumptions must be more conservative than in a market value report.
- Financial Reporting – fair value under IFRS 13 requires disclosures on unobservable inputs and sensitivities; for details see the article on real estate valuation for financial statements.
- Taxation – purchase price allocation, depreciation and property tax presuppose a clean separation of building and operating equipment.
- Project development – Feasibility study and project cost calculation before acquiring the site, while the connection question is still open.
What a robust appraisal report must contain
- the secured connection capacity in megawatts, with a reference to the grid connection commitment and details of the deadline and the connection charge paid,
- the derivation of the price per kilowatt from contract and market data, kept separate from the pass-through of the energy supply,
- separate useful lives and reinvestment cycles for the shell, the technical equipment and the fit-out of the IT space,
- a statement on the alternative use potential and how it is reflected in the risk assumptions,
- the regulatory status under the EnEfG, including the retrofit requirement and its valuation,
- a sensitivity analysis for connection capacity, price per kilowatt, utilisation and discount rate.
Conclusion
Valuing data centres means capturing a property, a technical facility and a supply entitlement together. Floor area is the least informative of these figures. What determines value is the secured electrical capacity, the availability and cooling concept, the contract structure per kilowatt and the question of what reinvestment in the technical equipment is already foreseeable.
Methodologically the ImmoWertV framework remains workable, provided the income side is built on capacity, the components are depreciated separately and the obligations under energy law are shown as a concrete cost item rather than a blanket yield premium. Anyone who discloses these four points delivers an appraisal report that stands up to investors, banks and auditors.
How strongly value depends on the operation is also evident in other operator-run properties – for example social-care properties such as care homes or student residences.
A related asset class with a similar dependence on technology and specific use is covered in the article Valuing industrial property: production halls, logistics centres and business parks
This same separation of property income and operating income is required for event properties: Valuing event arenas and stadiums: What determines the market value of a multi-purpose arena
Dieselbe Abhängigkeit von einem gesicherten Anschluss prägt die Speicherseite der Energiewende: Valuing caverns: market value of salt caverns for gas, oil and hydrogen
How value is derived from sustainably achievable income is shown by the Income approach.